Monday, August 20, 2012

Visualizing SystemVerilog event regions

One of the strengths of assertions in SystemVerilog is its well defined sampling semantics. Though it works out-of-the-box and is robust, many users don’t seem to understand it in depth. As we have been blogging on assertions – one needs to be very “pedantic”, i.e. detail oriented to be able to appreciate it, demonstrate it and understand it.

We at TeamCVC have been pioneering assertions as a focus area since our PSL book days (end of 2003, http://www.systemverilog.us/psl_info.html) and it has been almost a decade by now! We cover this in all our training sessions on assertions such as:

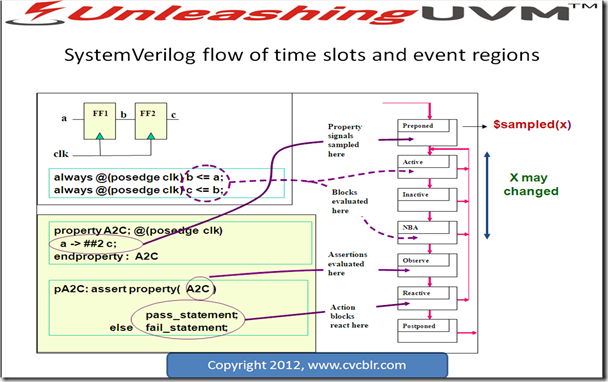
Even during our popular VSV course (http://www.cvcblr.com/trng_profiles/CVC_LG_VSV_profile.pdf) we touch upon this topic during the program block discussion. Below is an extract from our training/book on SVA (http://www.systemverilog.us/sva_info.html):


SV_event_regions


While the above slide goes well into the depth of this topic, often users ask us if they could “visualize it” inside waveform. Recently we did a SVA class for a VHDL customer who use Questa. Being part of QVP http://www.mentor.com/products/fv/partners/qvp we at CVC have access to Mentor’s latest technologies and this customer insisted that we use Questa during the labs. We enabled more debug sessions including their famous Questa ATV (Assertion Thread Viewer) feature. One of the nice examples our TeamCVC have created explains the events/time-regions nicely. See below for a screenshot:

Picture1


It is almost the same as SystemVerilog LRM’s event Queue – brought inside the waveform, isn’t it! Here is a code snippet for the RTL regions such as “ACTIVE, INACTIVE & NBA” – this is same as in plain Verilog BTW:

rtl_regions


Now recall that in testbench with System Verilog there is a program block that executes in REACTIVE region. And so are the assertion action-blocks. And within program block one can do blocking, #0 and NBA ssigns. So how does that get scheduled?

Picture1


And relevant code-snippet for the REACTIVE assignments:


pgm_regions


Putting the full waveform:

Picture1


NOTE: the “time” doesn’t advance, it is only the DELTAs – Questa is powerful indeed in visualizing it, we will try and add other tool screenshots in near future if there is enough demand from you – our beloved readers!

Before we close, here is what a full, IDE (Integrated Development Environment) that Questa provides for this:

image

Hope you enjoyed this “flow of events” and the power of “visualizing” it – as much as we did. Drop your comments below!

Signing off with confidence, it is TeamCVC!
Sunday, August 19, 2012

Verilog PLI/VPI – a sample tree walker + hierarchical print_timescale app!

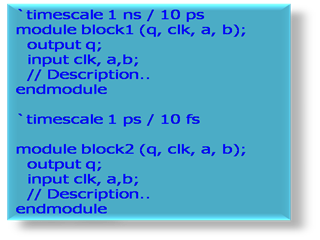
Here is a nice Verilog VPI (Verilog Procedural Interface a.k.a PLI 2.0) app that we mentioned during our just concluded Verilog training at CVC.

This application just walks through the complete design hierarchy and spits out the Timescale information for each module. It is quite handy to find which module has the least timescale precision value (and hence controls the whole simulation) for e.g. when the design has been given as a compiled database or a protected one – simple grep/PERL kind of ideas maynot fit. This application will extract:

  1. The module name
  2. Its Time Scale value
  3. Its TimePrecision value

Here is a PLI task named " $print_timescale " which if called on a top level module will print this information for the entire hierarchy.

The following Verilog code (which could be the top level of your design, or TB) shows how to use such a task.


vlog_topvlog_blk


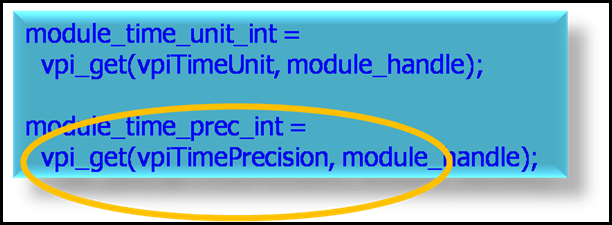
Needless to say the hierarchy can be very deep and totally encrypted etc. It is all about tree traversal and printing the relevant portions of vpi_get as in:

Following is a code snippet from the VPI/PLI C-code:

vpi_c


Now wrap that inside a tree walker code that would walkdown your Verilog hierarchy (post elaboration) such as:


binary_tree_complete  


At each node, print the results.

results


Drop us a note in the comments below if you would like to see the complete VPI code listing!


Who said Verilog is simple – it can become very interesting with large designs with interesting challenges!

Now you see why CVC is in the best of Verification related technology when it comes to training engineers (freshers/experienced alike) – where else would engineers get to experiment and learn at their own pace all the way from UNIX, Verilog to SystemVerilog, Assertions, UVM and beyond? See http://www.cvcblr.com/trainings for more!

Technorati Tags: ,,,,

Verilog subtleties - $monitor vs. $display vs. $strobe

Last week, our good friend Gaurav Jalan wrote a nice blog at: http://whatisverification.blogspot.in/2012/08/laws-and-verification.html 

He has adapted Murphy’s law into Verification as:

Applying to Verification (http://whatisverification.blogspot.in/2012/08/laws-and-verification.html )

Moore’s law – Amount of code to be verified doubles every 2 years.

Murphy’s law – Any code that isn’t verified will not work.

Now as I recap on last week’s Verilog session delivered to an excited IIT-KGP audience, I realized the same law is applicable to slides/PPT/training too :-) Especially be careful with any code snippet shown in the slides – they  could be wrong – unless verified otherwise!

Now back to the title of this blog entry – what are the differences bet’n Verilog’s $display, $monitor & $strobe?

1. Usual answer: $monitor is “continuous monitoring” – Yes, good

For many fresh graduates the detail stops there – but not for those “verilog hungry, pedantic folks”. Here are some more:

1. $monitor & $strobe execute at the POSTPONED region of your Simulator’s event Q – read more about it in LRM or attend our detailed simulation/SVA training (http://www.cvcblr.com/trainings) for more details on this event queues etc.

2. With $display you may get more than display for the same time, for the same signals being displayed – but with $monitor you are guaranteed to get only one at any time for the same display list. As the LRM puts it:


(With $monitor being in use) If two or more arguments change value at the same time, only one display
is produced that shows the new values.
Only one $monitor display list can be active at any one time

The above can be little misleading statement – infact that was the case with our UNVERIFIED PPT slide with some code snippet. Here is a fixed example with some traces:

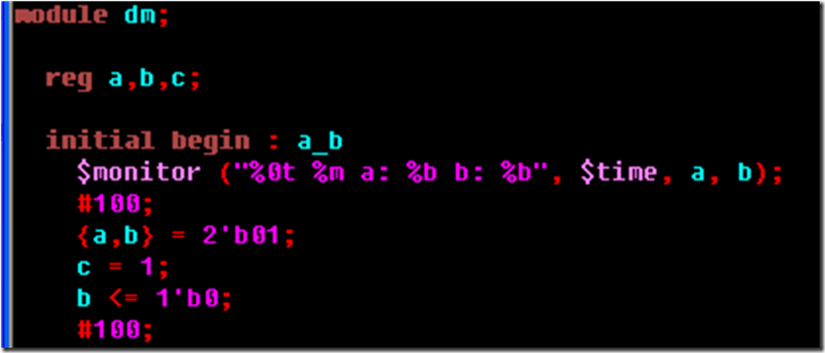
Consider the test vector setup as:

 Picture3


Notice that at time 100 we have “b” being assigned twice – one with BLOCKING and another NBA. With $monitor - you get only one display as guaranteed by LRM. However if we try mimicking the same with always block as below:

Picture6


Guess what – you get the display twice, see below:


Picture4


Now a more equivalent mimic would be to use $strobe instead of $display as in:

Picture5 


Now with SystemVerilog there are few more you could expand this topic to including:

1. Use always_comb instead of always @ (*) in the code above – it is guaranteed to wakeup at time 0

2. In the context of SVA (System Verilog Assertions), in 2009 the LRM added “deferred assertions” to handle similar situations.See: http://verificationguild.com/modules.php?name=Forums&file=viewtopic&p=19966 and http://sv-verif.blogspot.in/2012/03/using-systemverilog-assertions-to-check.html


So that was good fun with “details” on what’s usually skipped as “simple stuff” during a Verilog training.  Below is full code incase you want to run, modify and experiment around:

Picture1

Technorati Tags: ,,

Tuesday, August 14, 2012

SVA: Endpoint detection in sequences

This week has been a great start for TeamCVC as we have had one of our best SVA training attendees from a local customer with solid, “pedantic” Design & Verification engineers attending the same. We at CVC cherish challenges and always prefer customers who keep us on our toes (than just a dull set of trainees who sit and “listen” all day along).

During some of the advanced SVA part of the slides, we showed the endpoint detection mechanism in SystemVerilog Assertions. To put it simply – an endpoint is an instantaneous result available at every-clock (or sampling event) vs... a temporal sequence is typically few clocks in length. In what followed as a good discussion we explored various forms of code.

Drawn from our popular SVA book (2nd edition, http://www.systemverilog.us/sva_info.html ), here is a slide with code contents.

SVA_Ept_2


Alas – we didn’t have a running simulator on the laptop connected to the projector during the training, it became little hard to “visualize” the waveforms. We promised the customer that we will revert back with a demo code and screenshot – and here is what we came up with  -after a tiring day at CVC – we still don’t call it a day until we satisfy our commitments! Here you go with the screenshot below:

Basically we have a sequence that reads as:


c1


Now consider that we have 2 assertions, one with the entire sequence and the other with endpoint detection:

 c2

c3


And to make it even more clear, let’s do the same in the consequent part as well:

c4


Here is what the trace and results look like; Note the “LENGTH” of the threads with and without the endpoints – after-all “endpoint” is a BOOLEAN result, it had to be “short-lived” :-)

SVA_Ept


Feeling satisfied (for the day), let’s now call it a day from TeamCVC. And yes, a Very Happy and PROUD Independence day for all Indians!