In our regular SystemVerilog, VMM trainings (www.cvcblr.com/trainings) we demonstrate the power of callbacks to go beyond the obvious usage – specifically a case study to demonstrate transaction level debug. While this topic has been around for very long time (IIRC, Cadence/DAI first provided it via SignalScan), its real application in day-to-day debug has not been as popular as it should probably be.
Some reasons for the slow progress in debug are due to the tool limitations, some due to user unawareness etc. Today we had this session again at CVC and users really liked it a lot. We decided to open up this stuff as there is more interest and share it with larger community.
We also got Verdi (tm) working on this design with simple addition of $fsdbLog – one doesn’t require extra virtual-interface anymore! Hurray! The Debug champion has once again provided a very useful feature for SystemVerilog, class based environments to be debugged effectively. See some of the screenshots below. A much more lively demo can be seen at:
http://www.slideshare.net/svenka3/transaction-level-debug-with-systemverilog-vmm-verdi
Add simple code for $fsdbLog – similar syntax as $display:
Start seeing transactions in Waveform (FSDB)
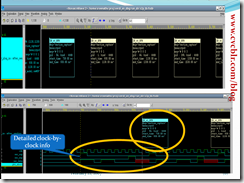
Verdi also presents a transaction browser in TEXTUAL form as shown below:
But to be honest – one needs to see the demo with action, try:
http://www.slideshare.net/svenka3/transaction-level-debug-with-systemverilog-vmm-verdi
for a PPS style. I’m also uploading a Video capture soon. Hopefully it goes through, then it will be lot more fun. If you wish to see it live on your designs, call us via info@cvcblr.com or www.cvcblr.com


No comments:
Post a Comment